Welcome to the Autism Classroom Resources Podcast, the podcast for special educators who are looking for personal and professional development.
Christine Reeve: I’m your host, Dr. Christine Reeve. For more than 20 years, I’ve worn lots of hats in special education but my real love is helping special educators like you. This podcast will give you tips and ways to implement research-based practices in a practical way in your classroom to make your job easier and more effective.
Welcome back to The Autism Classroom Resources Podcast. I am Christine Reeve and I’m your host. We have been talking about systems for organizing your classroom to help things become automagic. Last week, we talked about organizing data collection. Now, if you’ve missed previous episodes about setting up the classroom and the systems that led us here, go back to Episode 80 at autismclassroomresources.com/episode80 and start from the beginning. But particularly, go back to last week’s episode and hear what I had to say about data collection. That would be autismclassroomresources.com/episode87. Because you have to collect the data in order to analyze the data.
Now, if you’re all up to date, today, we’re going to talk about systems to organize analyzing your data. Because let’s face it, your data does you no good if it just sits in a binder. Now, I’m also going to include a link in this post for how I organize the data in a binder because I realized I hadn’t talked about that in the last episode. I have a whole post on creating program books for students. I will include that in this post as well. But I really want to talk about analyzing data today.
There are three reasons why we take data. One is for legal reasons. One is to show progress. But the one that is most critical in the classroom is to troubleshoot learning issues. For all of these, analyzing the data is the most important but for troubleshooting, it’s critical. You do not want to discover the problem the night before the progress report goes out. You don’t want to suddenly discover that the student did not make progress. Setting up systems for regular analysis is so very important.
Now, I can’t teach you all about analyzing the data in the podcast, partly because it’s visual and partly because we just don’t have enough time. That’s actually something that is a whole part of our Taming the Data Monster course in the Special Educator Academy. But instead in this episode, I’m going to focus on how you make that analysis happen. I have three elements to think about in order to develop systems to make sure that your data gets analyzed and to make that process practical for the classroom. I have a free tool for you from the academy to save you time that I’ll talk about as well that can help.
Now, as I mentioned, if you want more information on really how to analyze and make sense of your data beyond what I have time to talk about today, I highly recommend joining us for the Taming the Data Monster course that is part of the Special Educator Academy. I’ve actually created a data analysis tool as part of that course. I walk you through how to analyze both instructional and behavioral data as part of that class. It’s based on the book Taming the Data Monster that I co-wrote with Dr. Susan Cabot. You can access everything in the Special Educator Academy with a seven-day free trial at specialeducatoracademy.com. Now, let’s get started thinking about systems to make this practical in your classroom.
The first question we have to ask is, “How do I use the data that I’ve collected? What am I going to do with it?” The answer is really three-fold. We’re going to graph the data so that we can analyze the data, so we can use it to troubleshoot instructional problems. That is really our focus here. Very, very interesting is the fact that we have very actual little data on data. We have very little research on collecting data in the classroom, which I find a fascinating fact. However, what the research does tell us is that teachers who graphed their data had students who made substantive and significant progress more than teachers who did not graph their data. That’s actually a study by Fuchs and Fuchs from 1986. A follow-up study by Jimenez, Mims, and Browder in 2012 found that teachers who graphed their data and used just a simple set of decision rules to evaluate that data, made more correct decisions about changes to interventions to improve student performance than before they used those rules.
Graphing data not only makes it easier to analyze the data but it also improves the performance of the students. I think that is an incredibly strong argument for doing it. I know a lot of teachers who will say, “I don’t need to graph the data. I can look at it and see.” You’d sometimes be surprised how data can actually be very misleading. Given that we know that graphing data is key, how do we build this into everything else that we have to do in the classroom without getting overwhelmed? Surprisingly, not. The answer is we set up a system, just like everything else.
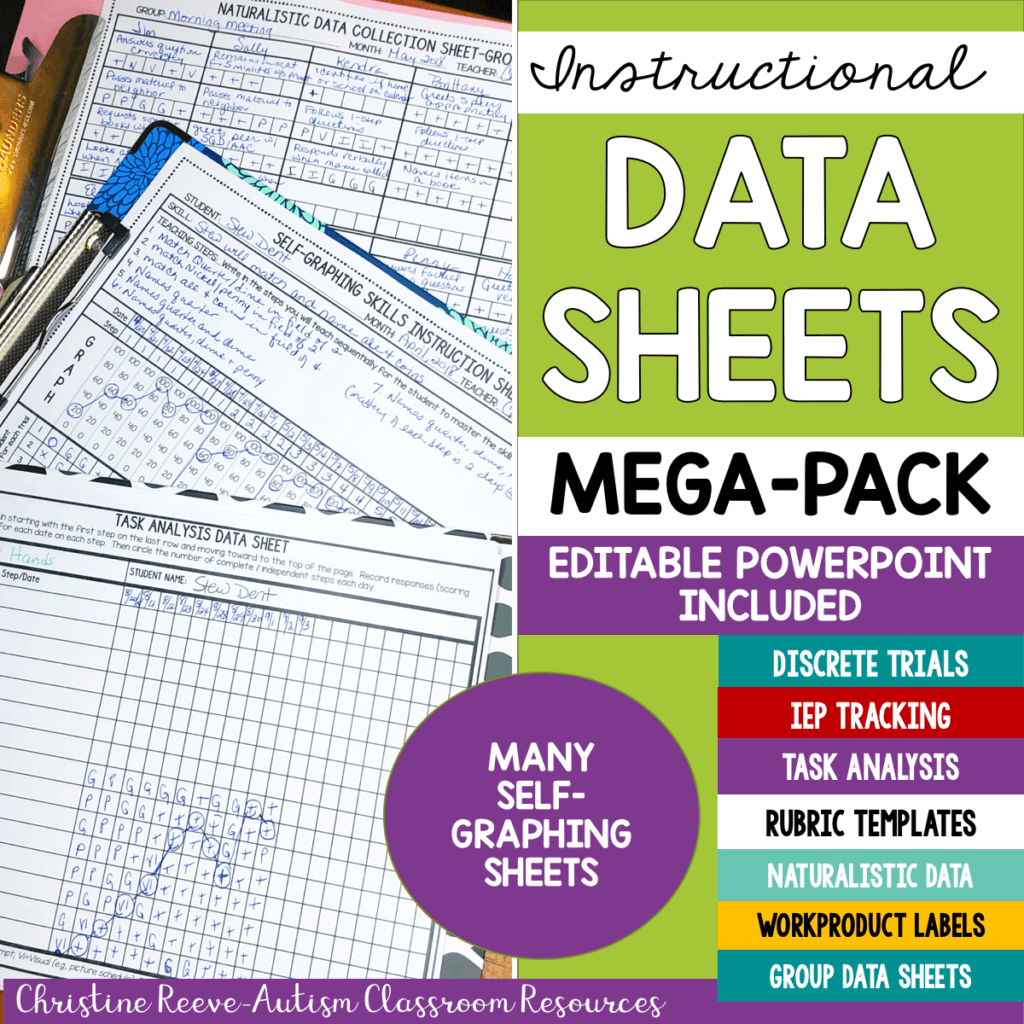
First, you need a template. Graphing data does not need to be difficult and complicated. In fact, in today’s post for this podcast, I have a free tutorial and a free Excel data sheet, which actually now is also a Google Sheet data sheet that will graph the data for you more automagically. In fact, if you have used this spreadsheet before, I’ve made it even better. It is now available in both Excel and Google Slides because Google Slides now has the trendline feature that kept me from doing that. I now can make it work.
The point of the spreadsheet is that it can be used with the naturalistic data sheet that I talked about in our last episode. The drawback of that data sheet is that you do have to move the data into some spreadsheet in order to graph it. You have to actually move it off the datasheet to do that. It doesn’t self graph. This spreadsheet was designed to solve that problem. Now, you could use the spreadsheet with any datasheet obviously but the thing that gears that up for this one is that you can actually graph data from three different activities for each skill. That works really well for that data sheet that is designed to take sample data across the day. The spreadsheet graphs the data across the whole year.
There are two reasons why I like that it graphs across the whole year. First, it puts all your data in one place. If you only need it for a quarter, like for an objective, just put the quarter data on the graph. But primarily, I like it because I can draw an aim line that shows where you started and where the data should be when you’re predicting mastery will be met on the IEP, then you just watch your data to see how it matches up to that aim line to see whether or not the student is going to master the goal or if you have a problem and whether or not you need to make adjustments down the road.
As I said, that’s a whole different ball game of discussion but I do have a whole tutorial on how to use the spreadsheet that will walk you through the intricacies of how to make it work to automatically graph the data from what you put in it. You can find a link to the video tutorial and the spreadsheets at autismclassroomresources.com/episode88. That spreadsheet and the tutorial is pulled directly from the Special Educator Academy. It’s one of our Quick Win videos. Actually now, it’s two because there’s also one for Google Sheets and tools that’s part of our membership. It’s an add-on to our whole course on Taming the Data Monster. If you want to know more about troubleshooting the data once you’ve graphed it, go to specialeducatoracademy.com.
Now, it’s great to have a template to put your data in but how do you fit this into everything else that you have to do? Because right now, I know it just seems like a whole bunch more stuff that you have to do. That’s where tip number two comes in. Let me tell you about Data Thursday. In the preschool that I used to work in, we were always struggling with how to get data graphed. Teachers were struggling because they found that they were always having to graph multiple weeks of data the night before progress reports were due. Of course, they were cursing those of us in administration who insisted that we do this. During training, we started talking about it and how we could streamline the process. What we came up with is Data Thursday. We decided that as a group, we would avoid planning any meetings or trainings for Thursday afternoons. Those afternoons would be reserved for graphing and processing the week’s data.
Now, in this school, we had the luxury of having planning time in the afternoon and having paraprofessionals staying during that time. I know that’s a luxury that many of you don’t have but stay with me because I’m going to talk about how to do this in different circumstances. Every Thursday afternoon, the team for the classroom would meet and input the data, and review the graphs and work samples, and troubleshoot if there were problems with the data. Then when progress reports rolled around, there were no more all-nighters. I hear you saying, “That’s really nice, Chris, but who has paras staying in the afternoon and who even has planning time these days?” I get it. Plus, who has a whole school who can plan not to have meetings on a specific day? However, this is a strategy that can be adapted on an individual basis. It’s been done by staff I’ve trained and by folks in the academy.
There are essentially two parts that I think are important to this adaptation. First, find an accountability partner. I recognize that it probably isn’t going to be a team member from your classroom because your paras don’t have planning time and they probably leave when the students leave. If they are there for planning time, they’re ideal. I’ll talk more about that on number three. But it could be another teacher in your district or if you’re like many special ed teachers and you teach on an island, it could be a distant teacher friend who you meet with on Zoom.
The accountability buddy is important because it keeps you reserving that time to do the data input. It helps you make it a priority and helps you not schedule other commitments during that time because if you’re just the only one doing it, it’s really easy to say, “Yeah, I’ll change my schedule. I’ll give this during that time.” But if you know that you’re committed to doing something at that time, it’s a lot easier for you to say, “I’m sorry, I have a meeting at that time. I can’t do that.” And you do, you have a meeting with somebody else and that other person is important. Somehow, it’s easier to prioritize that other person over ourselves.
Second, set aside that specific time and meet with your accountability partner during that time. It could be one afternoon a week. If you’re an early bird who likes the morning, use your early morning time. Whenever it is, set aside one period of time weekly to input the data. If you do that, it doesn’t become overwhelming. It allows you to look at it weekly and make changes to the teaching to make sure that you’re tweaking your instruction for the benefit of your students.
That brings me to system number three that is also extremely important as part of this overall process. I talked in Episode 87 about the quality of the data being so important. Because of that and the fact that you can’t be taking all the data by yourself, you have to get the paraprofessionals on board with the analysis process. You know how you make sure that they are working hard to assure they’re taking data accurately, show them the data. Show them the analysis. Let them know how the data that they are taking affects the decisions that are made. Let them see the graphs. Let them know how you’re changing instruction based on the information that you got from the data that they took. Give them feedback, positive feedback, and sometimes, corrective feedback—always more positive feedback than corrective, of course—about their data when you’re reviewing it. I like to use post-it notes on data sheets. As I’m going through them, I write post-it notes. Unless it’s an issue that needs a more in-depth discussion, I just stick post-it notes on there. Even just a post-it note that says, “I love the way you got five trials out of this situation,” or “This is awesome data, wait until you see how well he’s doing,” or something like, “That can go a long way, the next time the para picks up that sheet to take more data.” Make sure you include them in the analysis process so that the data they take isn’t just paperwork that they have to fill out.
Now, I know that was a lot to get into and I’ve talked way long enough but I hope that these three tips give you ideas of how to make data analysis something that you can fit into your classroom. Don’t forget to head over to the blog post at autismclassroomresources.com/episode88 and grab the Quick Win video, as well as the spreadsheets for graphing your data. I release them directly from the Quick Win videos of the Special Educator Academy. If you want to try out the Taming the Data Monster course, come to specialeducatoracademy.com and try us with a seven-day free trial.
Thanks so much for tuning in. Don’t worry, I know that school is starting, or has started, so I’ve got a ton of shorter episodes coming up with our next phase for systems, which is troubleshooting. Until then, I’ll just be over here trying to figure out how to have Clean My House Tuesday. That would really help.