Research tells us that teachers who graph instructional data have students who make better progress. Yep, it’s a true story. And using specific guidelines and processes are part of what make it successful. Analyzing data is critical to why we take it in the first place. We take it to inform our instruction. We take data to make course corrections before our students’ learning gets too off track.
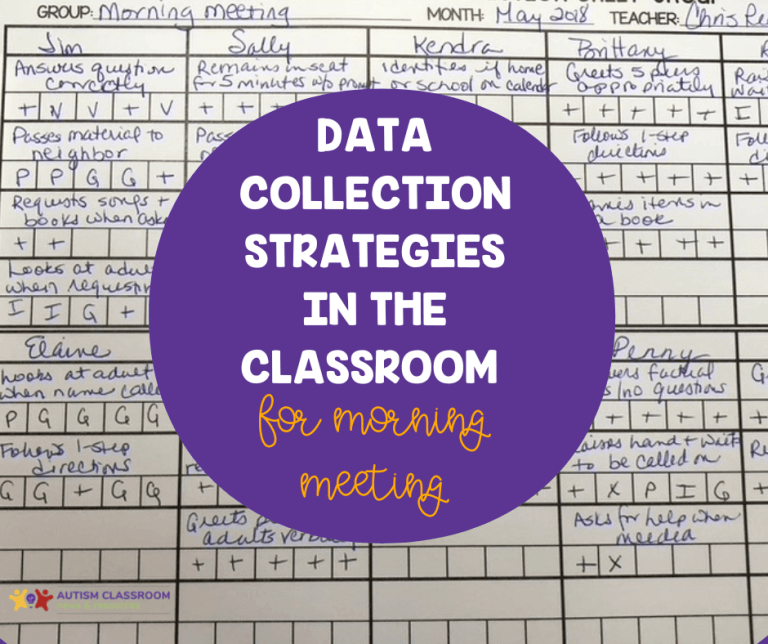
So that means that we need to set up systems of data collection and analysis to make the whole process work for us. I talk about systems for data collection in episode 88 of the podcast. Then I talk about establishing systems for getting data analysis done on a regular basis in episode 89. Those are great episodes to read or listen to for ideas about how to fit it all into your routine. Because it doesn’t have to overrun your life. But it does work better if you pay attention to it regularly.
To help with that, I developed a number of tools as part of the Special Educator Academy to help the members graph instructional data regularly and then to analyze that data easily. And today I am sharing one of those tools with you.
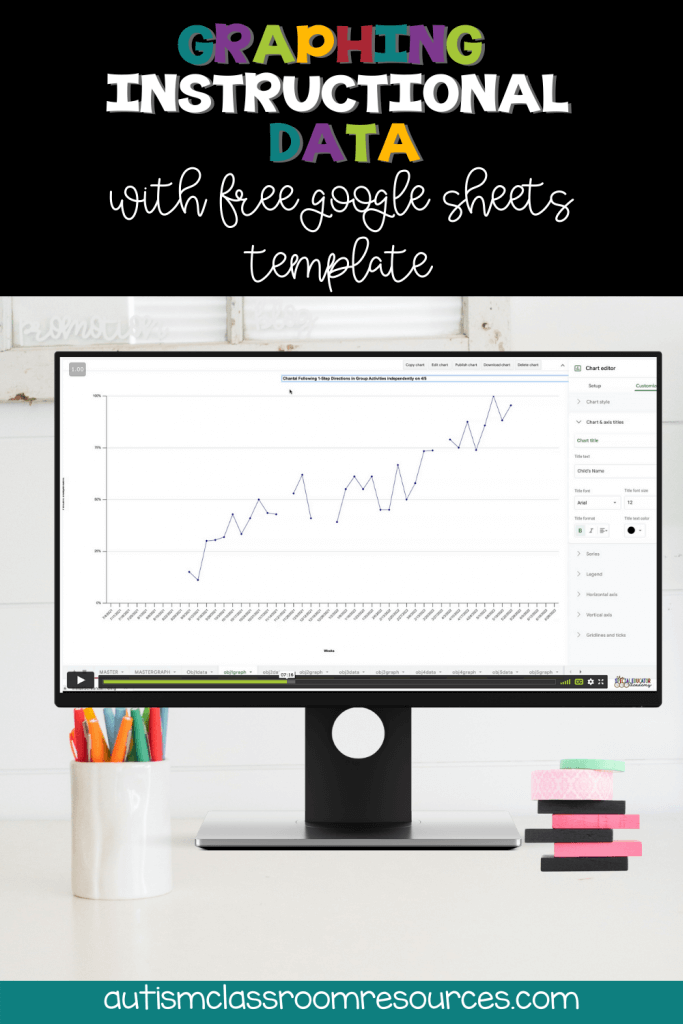
Google Sheets Template to Graph Instructional Data
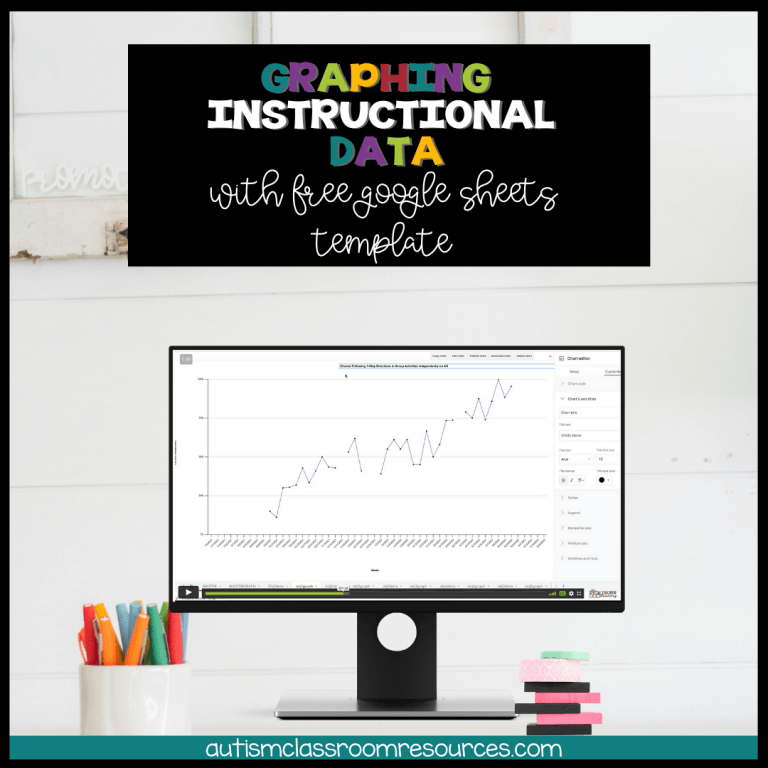
The way to make it easiest to graph data is to have a template. For years, I’ve had an Excel spreadsheet that allows you to put percentage data in (e.g., 4 correct / 5 opportunities) data in from up to 3 activities and it calculates and graphs it for you. You can find the Excel spreadsheet and the Quick Win from the Academy here.
I have never made a similar one for Google Sheets because the Excel spreadsheet allowed you to easily draw trend lines, but Google didn’t. Google still isn’t great about letting you draw aim lines, but you can do it. So, I recently added a Google Sheets version for graphing instructional data to the Academy.
When To Use the Graphing Template
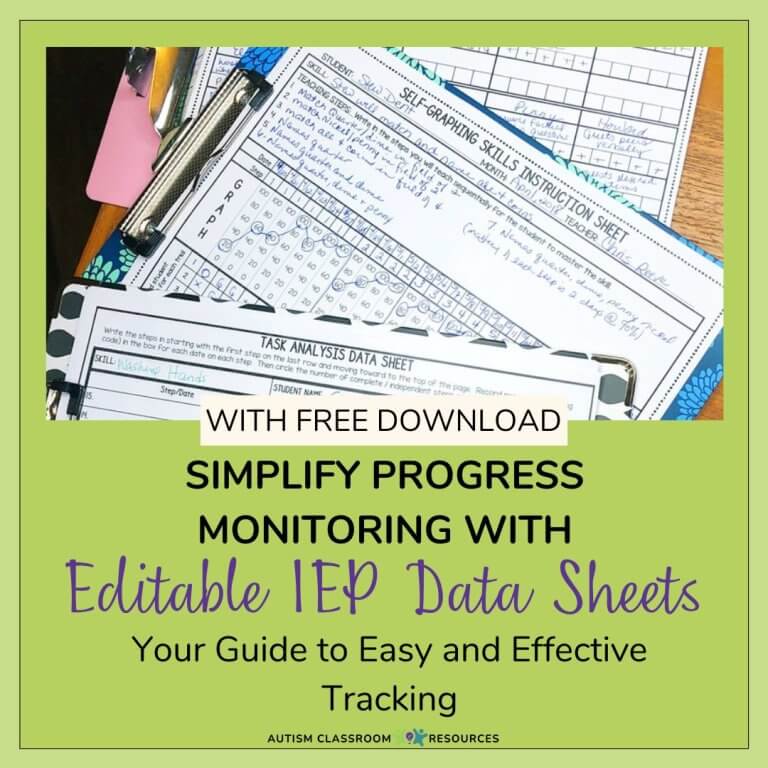
I use these graphing templates with the naturalistic data sheet (or group data sheet) from my Instructional Data Sheet set on TpT. There is a free version and a tutorial available in my store here. And a newer version available in my larger set of progress monitoring data sheets here.
The template will only work with data that can be figured as percentages. For frequency data or duration data or other types, you would need a different type of graph. This template is designed to help graph data that is designed to be X out of Y opportunities. Often I am taking this data as sample data. For more ideas on planning your data collection strategies, check out the free webinar at the bottom of the page.
Quick Win Video Tutorial: How to Graph Instructional Data
And to help you, I’ve pulled the video Quick Win training from the vault to share here along with the Google Sheet Template that you will find in the free Resource Library.
In the video I walk you through step-by-step how to copy and open the document, how it is set up and how to input the data. I’ll show you how to delete elements that might keep it from graphing. And how to individualize your graphs. Finally I show you how to draw an aim line and how to use a trend line to determine if the student is making progress or if there is a a problem.
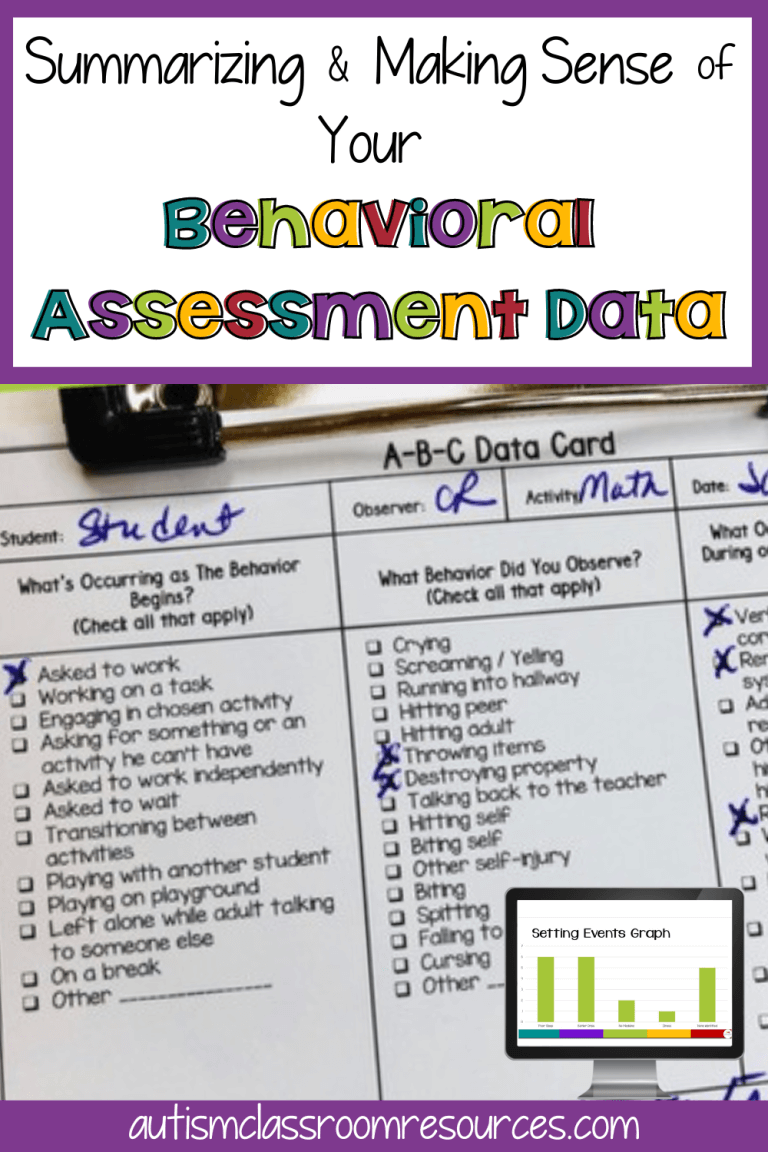
In the Academy we also have a tool with decision rules to help look at the data when there is a problem and troubleshoot. If you are interested in learning more about the Special Educator Academy, we have tons to offer in terms of support and training to special educators with hands-on practical tools and strategies. Our job is to make your job easier. Come try us out with a 7-day free trial.
sign up for free tips each week in your inbox and Grab the free Google graphing template from the resource library
Grab the free Google template and get started graphing your data today. Easy to use and keep up on a weekly basis to monitor progress data.