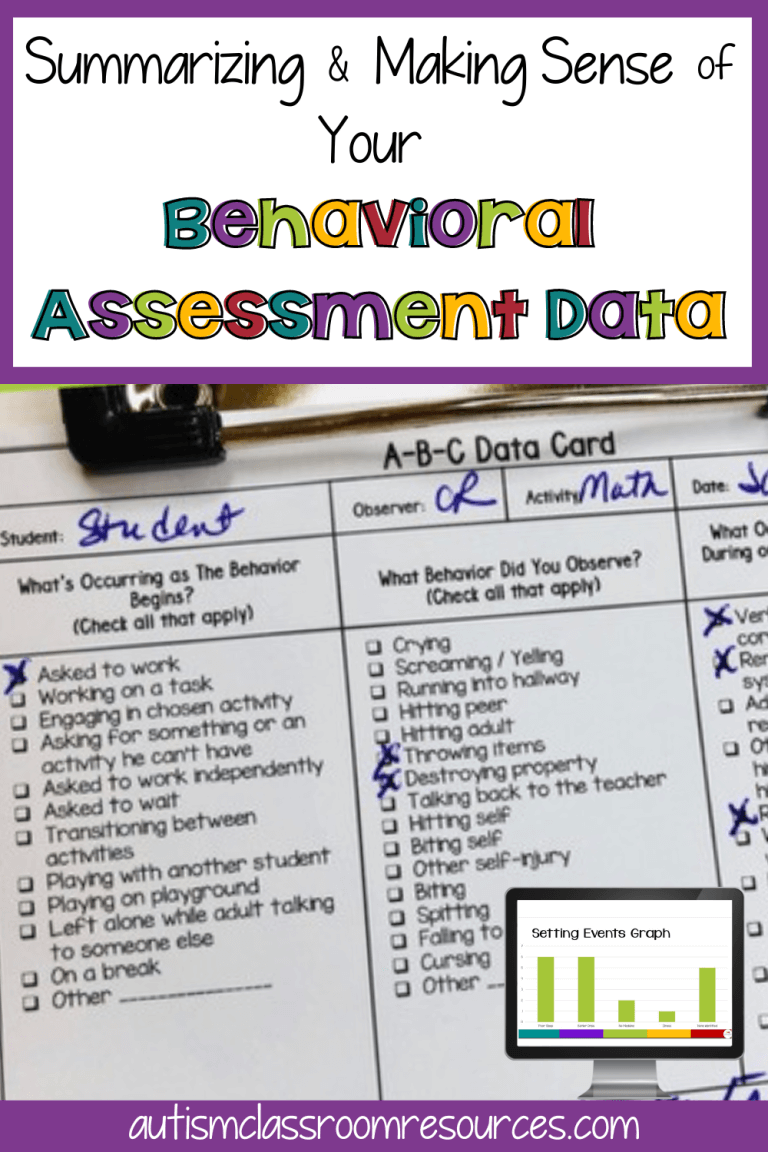
We talked about behavioral assessment data, including ABC data collection, so now we have lots of background information, indirect assessment and ABC data collected. The next step is to start to make sense of it–we need to analyze ABC data for it to help us. And, as with most things, the first step is to organize and summarize it so we can develop a hypothesis about the function of the behavior.
Sometimes this is a simple task, but most times it’s a bit more complicated. Your indirect assessment may or may not match up with your behavioral assessment data. Your data may seem like it doesn’t show a pattern at all. So, I wanted to share some tips on how to summarize and analyze your data to try to see some patterns and develop hypotheses.
Summarize Your Data
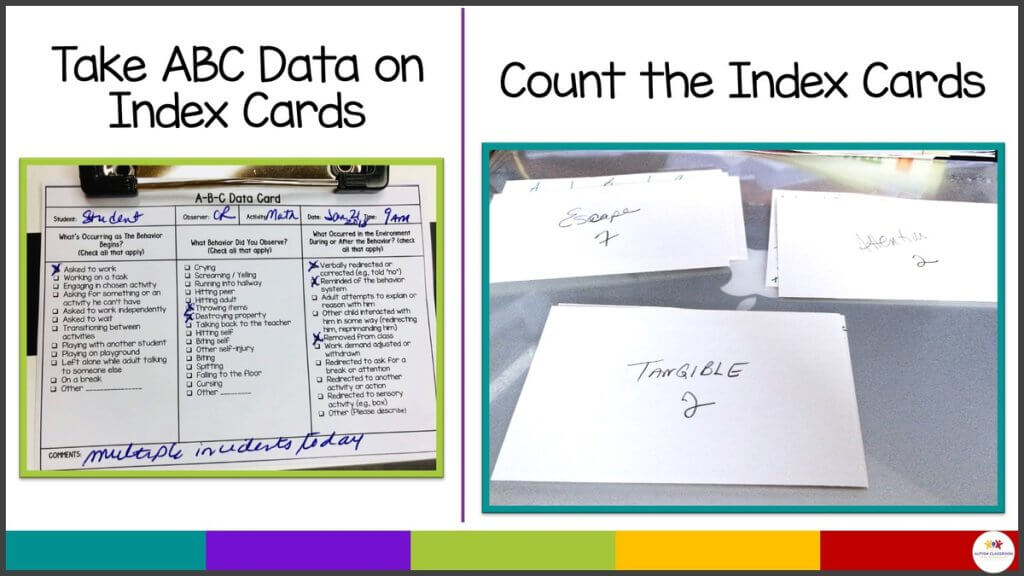
The first step to analyze your ABC data is to summarize it in some way. If you collect ABC data using index cards, you can stack them in different ways to see which are the highest elements you are analyzing. It’s a good way to avoid having to graph the data but still get quantitative information about the frequency of different elements in the data (e.g., common antecedents). I wrote a post about using index cards to collect ABC data that you can check out HERE.
When I Analyze ABC Data, Do I Have to Graph It?
If you used data sheets instead of index cards, you will need to graph the data in some way. You can use a graphing program like Excel or graph it by hand. But graphing is the most efficient method to see patterns within the data and make sense about it. f
It’s amazing how many times I’ve thought there was no pattern to the data and then saw one after I graphed it. Or even more surprising when I thought that the behavior was functioning for one function, like to escape work, only to find out the data showed more instances of behavior for another function, like getting teacher attention. This is why we can’t go with our gut and really do need to summarize the data to make decisions.
How Should I Graph My Data?
The question my grad students always ask is “HOW should I graph the data?” So I wanted to share some ways I graph it to look at the impact of different variables. I don’t necessarily summarize each one of these variables. But if you haven’t done many FBAs or you can’t determine what variables might be relevant easily, summarizing by all of them might be helpful.
I’m not going to share a lot of explanation as that would just take too long in a post. But here are some examples of ways that I often graph the data to get a handle one what it tells us.
Examples of Factors to Graph From Your Data
These are just some examples of the ways I might graph the data. There are many different ways to look at the data depending on the data you have. We have a whole section of the Taming the Data Monster course that focuses on how to graph data as well as a tool to help members graph the ABC data in the Special Educator Academy. Find out more below.
Note that we are almost exclusively looking at ABC-type of data, because it is the only type of data that is telling us anything about the context of the behavior. Frequency data collection and other types of data that just tell us about the behavior itself, but don’t tell us about its function.
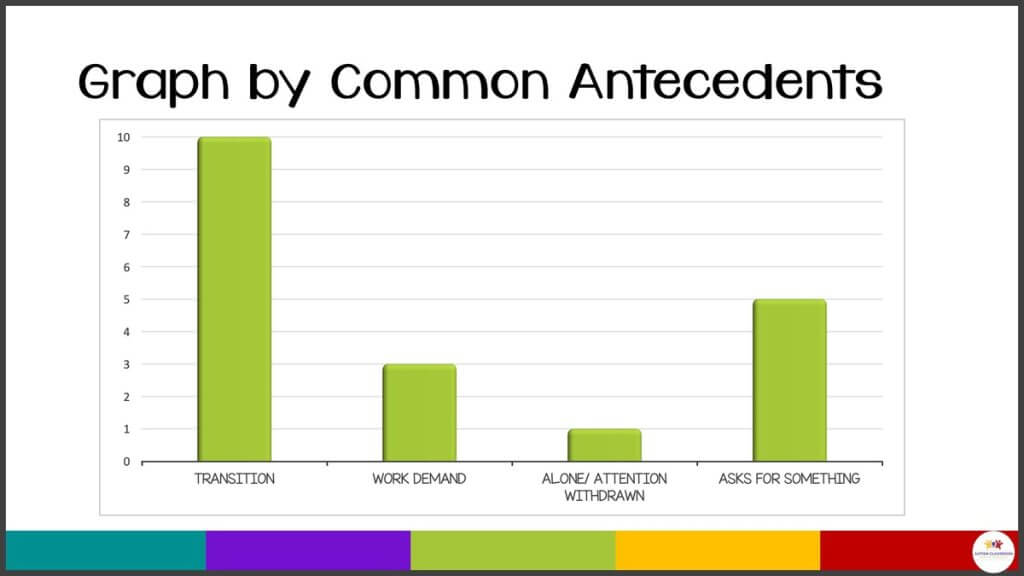
Graphing Behavioral Assessment Data by Antecedents
Sometimes I can break things down to more detailed levels about the kinds of antecedents that preceded the behavior (e.g., transitions instead of specific events). We don’t know at this point whether these behaviors actually trigger the behaviors. And we won’t know until we see if our hypotheses statements pan out with our treatment. But when you analyze ABC data, it is about collecting patterns.
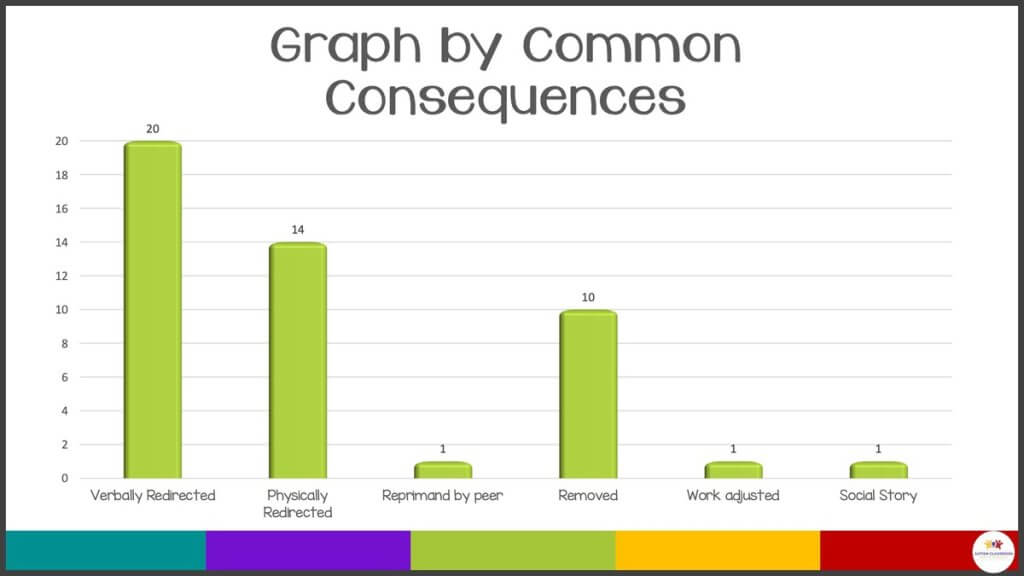
Graphing Consequence Behavioral Assessment Data
Similarly, consequences can be grouped together. In other words, what happens after the behavior occurs. It’s important in looking at your consequences that in well-collected behavioral assessment data, there will always be more events happening after a behavior problem than actual events of behavior. Because the point of the data is to collect information about the whole context of the situation.
And also, remember that many of the recorded consequences in the behavioral assessment data will be strategies that are automatically tried. So, in the graph below you see redirection as the highest consequence for the behavior. But it’s also the first strategy the team used for this behavior. So that’s not surprising. When it didn’t work they moved on to other strategies. So just looking at this data actually wasn’t nearly as useful as looking at data about when the behavior stopped happening in the chain of consequences.
Graphing Setting Events Data
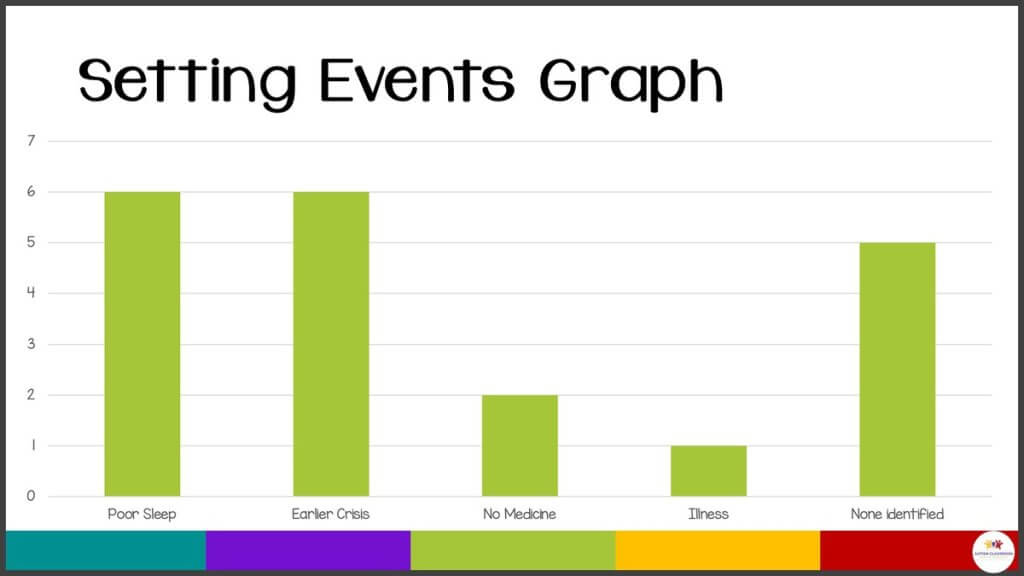
I talk about setting events and their impact on behavior in this podcast / post. These are events that happen outside the immediate context of the challenging behavior that might be impacting its occurrence. You can see that there are some that might be impacting this child’s behavior. But there were also instances that no one could identify a setting event that might have been a factor. This can help determine if here are outside variables that have to be addressed.
These are just some examples of the ways I might graph and analyze abc data. There are many different ways to look at the behavioral assessment data depending on the data you have. For instance, I might graph by possible hypothesis of the function of the instance of behavior or settings in which the behavior occurred. The key is to summarize the data until it tells you a story.
Looking for more ideas on how to graph behavioral assessment data? We have a whole section of our data course with tools to help on how to break it down in the Special Educator Academy.

Join Us!
Come get a free trial in the Special Educator Academy where we have workshops and study groups on them.
Never Forget to Share the Data With Those Who Collected It
Finally, his is really important in applied behavior analysis in general and any situation, in which you ask staff to do data collection. Don’t forget, once you graph the ABC data, share that information with the people who took the data. If the behavioral assessment data was collected by paraprofessionals or other professionals in addition to you, it really helps for them to see how it contributes to problem solving and planning so that they see how critical it is to helping the student and isn’t just a piece of paper to fill out!
For more information on the next steps, which are creating hypothesis statements from your data, check out this post.
And if you are looking for different types of data collection sheets, including ABC data index cards, check out my Behavioral Data Collection Sheet set!