

What are behavior data collection sheets?
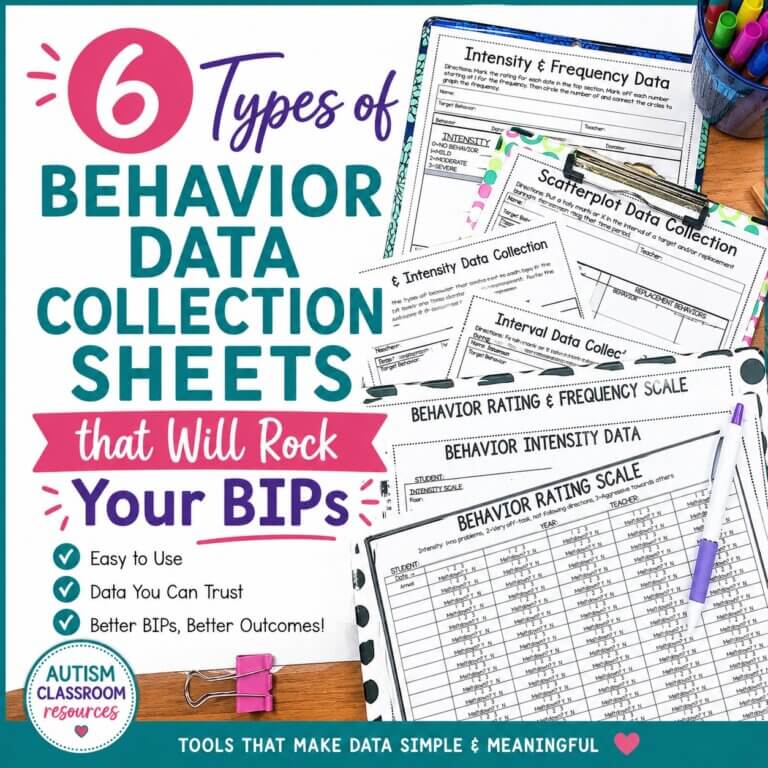
Behavior data collection sheets are simple forms you use to track a student’s behavior so you can tell whether your behavior plan is actually working.
The right sheet depends on what you need to measure: how often a behavior happens (frequency), how intense it is (a rating scale), when it happens (interval or scatterplot), or what’s driving it (ABC data).
The set in this post includes six types — rating scales, frequency, interval, ABC, scatterplot, and combination sheets — and many of them graph as you go, so analyzing the data isn’t a separate job at the end of your day.
Table of Contents
Updated August 9, 2026
Is it possible to love behavior data collection sheets? I’ve already admitted I am a data geek. But now I think I have actually fallen in love with these behavior data collection sheets! Seriously!
You know why I love them? They are easy to use. And many of them graph as you go, so there’s no extra step for analyzing the data! What??
I know, I’m normally much more serious than this in a post, but, what can you do? So let’s look at some ways that you can simplify your behavior data collection!
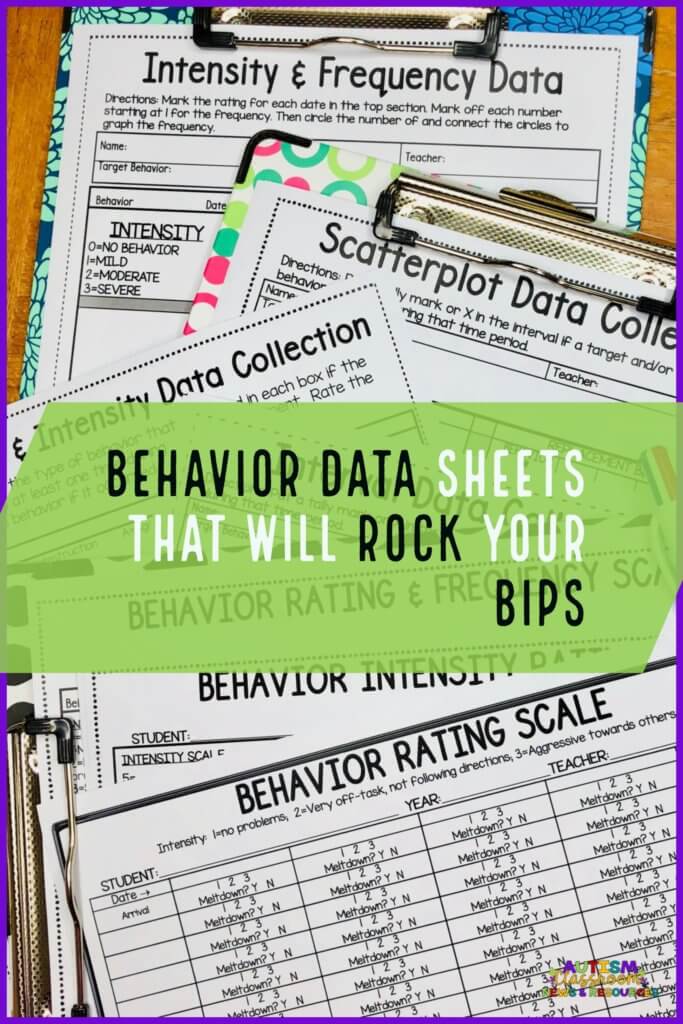
BTW, you can purchase the data sheets by clicking on any of the photos–then choose to buy in my store or go over to my TpT store–your choice.
Rating Scales
Rating scales can be your best friend when all you need to do is have an assessment of whether your behavior interventions are working or not. These aren’t the kind of rating scales that you use to check off behaviors to indicate symptoms of autism or ADHD. They are anchored scales that you use to rate the level, severity, or frequency of behavior each day.
In the top picture to the right, the data points are easily connected to make a graph. I use them for:
- rating intensity or severity of behavior
- rating students’ level of anxiety or activity
- teaching students to self-monitor their own behavior and check ratings with adult observers
- track students’ ratings on the 5-point scale or have them graph it to self-monitor and assess
In the bottom behavior data collection sheet, you rate the day by 1, 2, or 3 of increasing problems. Then indicate if there was a meltdown that day. I designed it for a student who counting the behaviors in the classroom would be almost impossible and we found it to be pretty reliable.
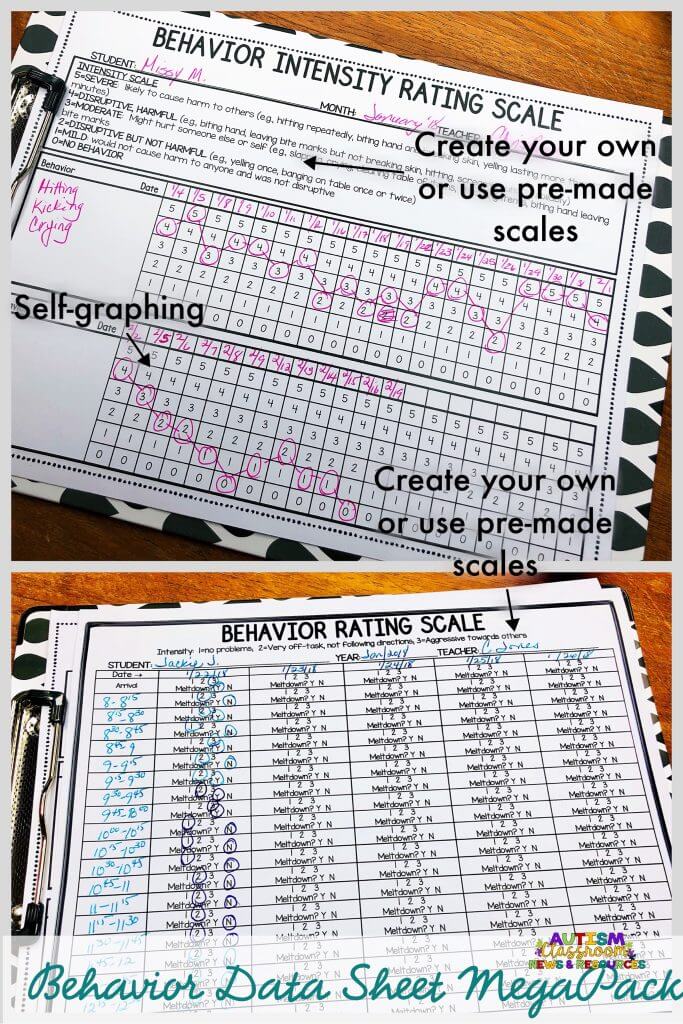
You can also use the scales to rate every interval (e.g., 15-minutes), activity (using the sheet on the bottom of the picture), or daily or morning and afternoon (using the one on the top).
Included in the behavior rating scales are the two in the picture above and 5 additional ones. All are editable so you can create your own scales or use ones I created.
You can purchase the data sheets by clicking on any of the photos–then choose to buy in my store or go over to my TpT store–your choice.
Combining Frequency and Ratings
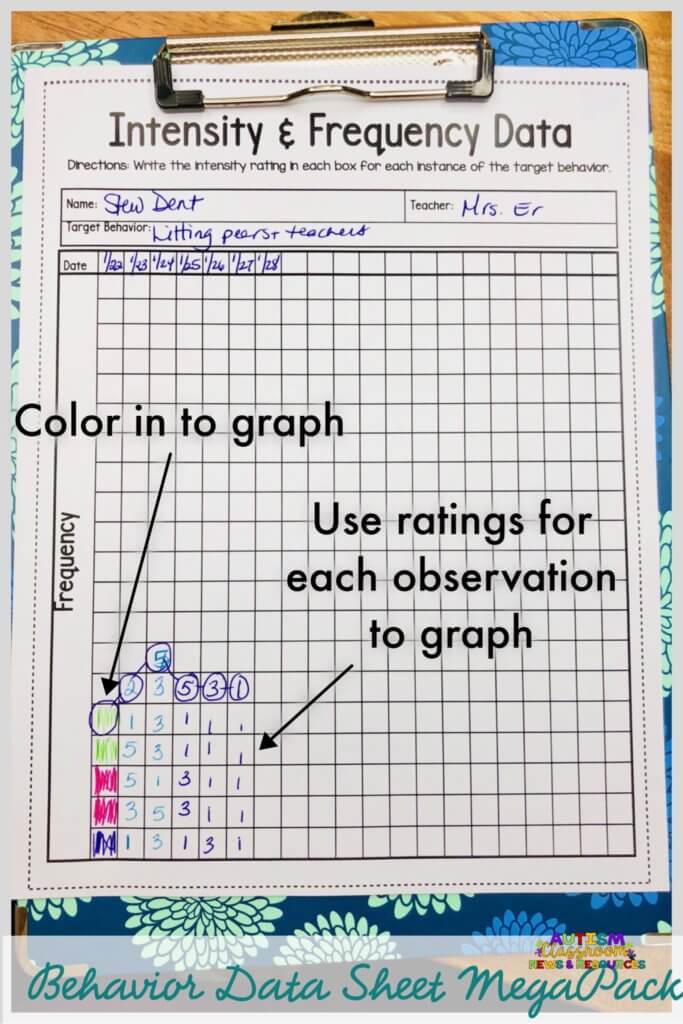
You can also combine rating scales with other measures like frequency or interval data sheets (see below). I love this behavior data collection sheet because it’s so flexible.
- You can color in the squares (bottom to top) to graph the frequency of data
- OR put a rating of the severity of the behavior (or anxiety, or 5 points scale or something else) in each box instead and you still have a bar graph. But then you can also track that measure by counting up the ratings.
Combining Interval Systems and Ratings
In addition to combining frequency and intensity ratings, you could also combine interval and intensity data.
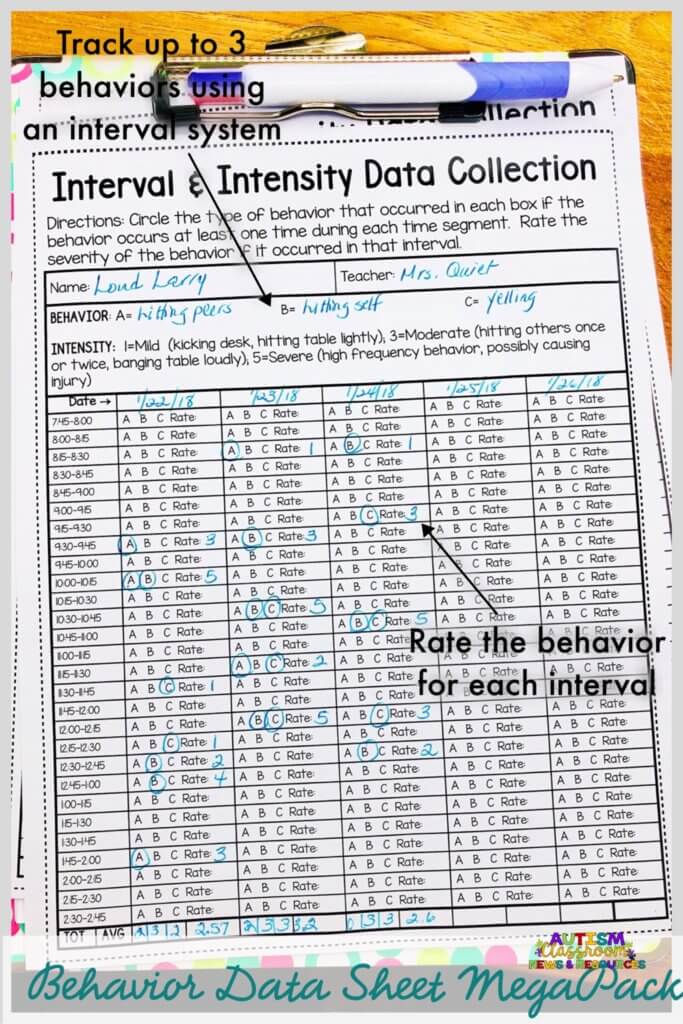
This form does not self-graph. But you can track 3 specifically defined behaviors through a partial, whole or momentary interval system AND rate each interval with problem behavior by the severity of the problems.
I realized that I’ve never talked about interval data on the blog, but I’ll fix that in the coming weeks. Essentially interval data is when you monitor the behavior in set intervals. Sometimes they are times, sometimes activities.
In partial interval data, you check to see if the behavior occurred in any part of the interval. Momentary interval data assesses if the behavior occurs at a specific time (e.g., the end) of the interval. And whole interval is recording the behavior if it occurs throughout the whole interval. Partial interval systems, in particular, are useful for taking data in a classroom because you record the behavior in the interval it occurs in and are not tied to watching the student faithfully through the whole time.
ABC Behavior Data Collection Sheet
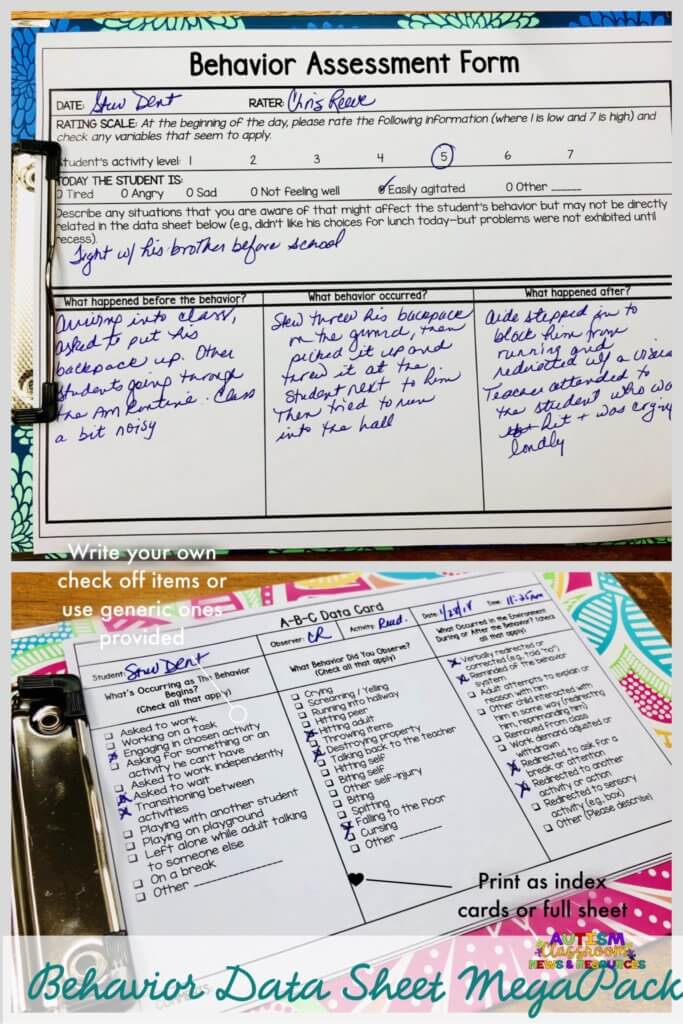
And a set of behavioral data sheets wouldn’t be complete without antecedent-behavior-consequence (ABC) data sheets. I’ve included some journal ones, including this one on the top. It has some rating scales to assess setting events that might affect behavior. I’ve also included those that don’t have those scales.
The one on the bottom is a check-off ABC form and there are lots of options with these. They can be printed as a full page (with 2 incidents recorded) or in index card size to be more portable and one incident per page. For a fast ABC summarizing hack, check out this post.
Good behavior data is the foundation of a functional behavior assessment (FBA) — one of the evidence-based practices identified in the National Clearinghouse on Autism Evidence and Practice (NCAEP) 2020 report. You can’t build a behavior plan that works without first seeing the behavior clearly, and that starts with the data.
Other Behavior Data Collection Sheets Included
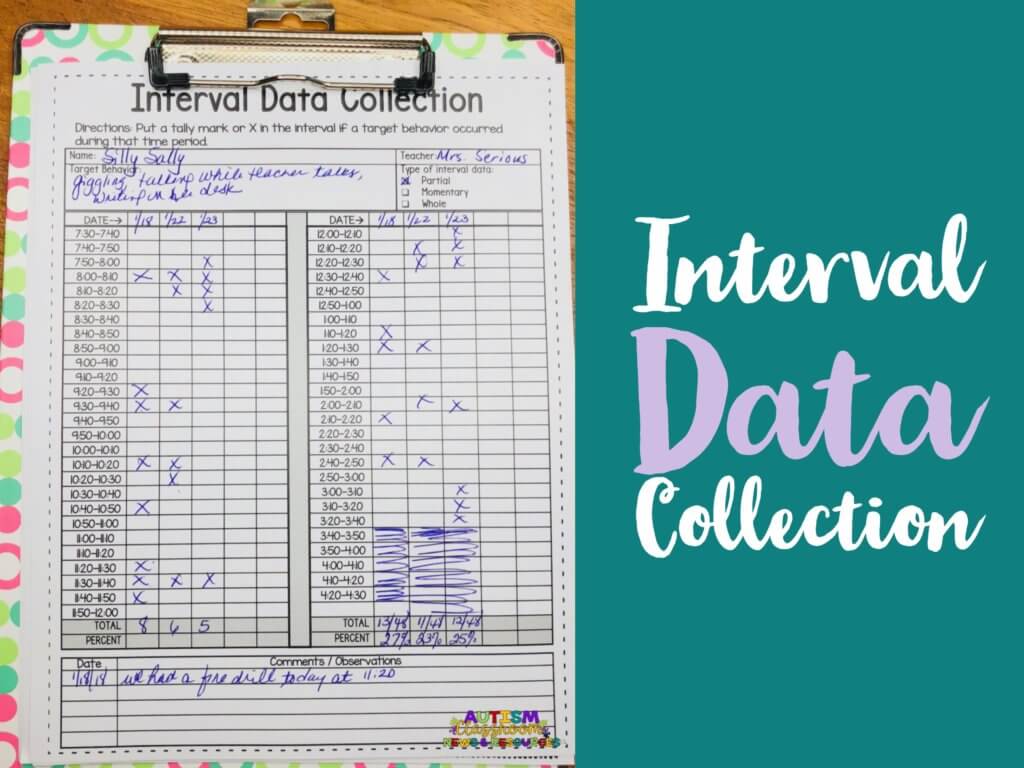
And, I’ve included about 5 different behavior data collection sheets of just interval data sheets as well.
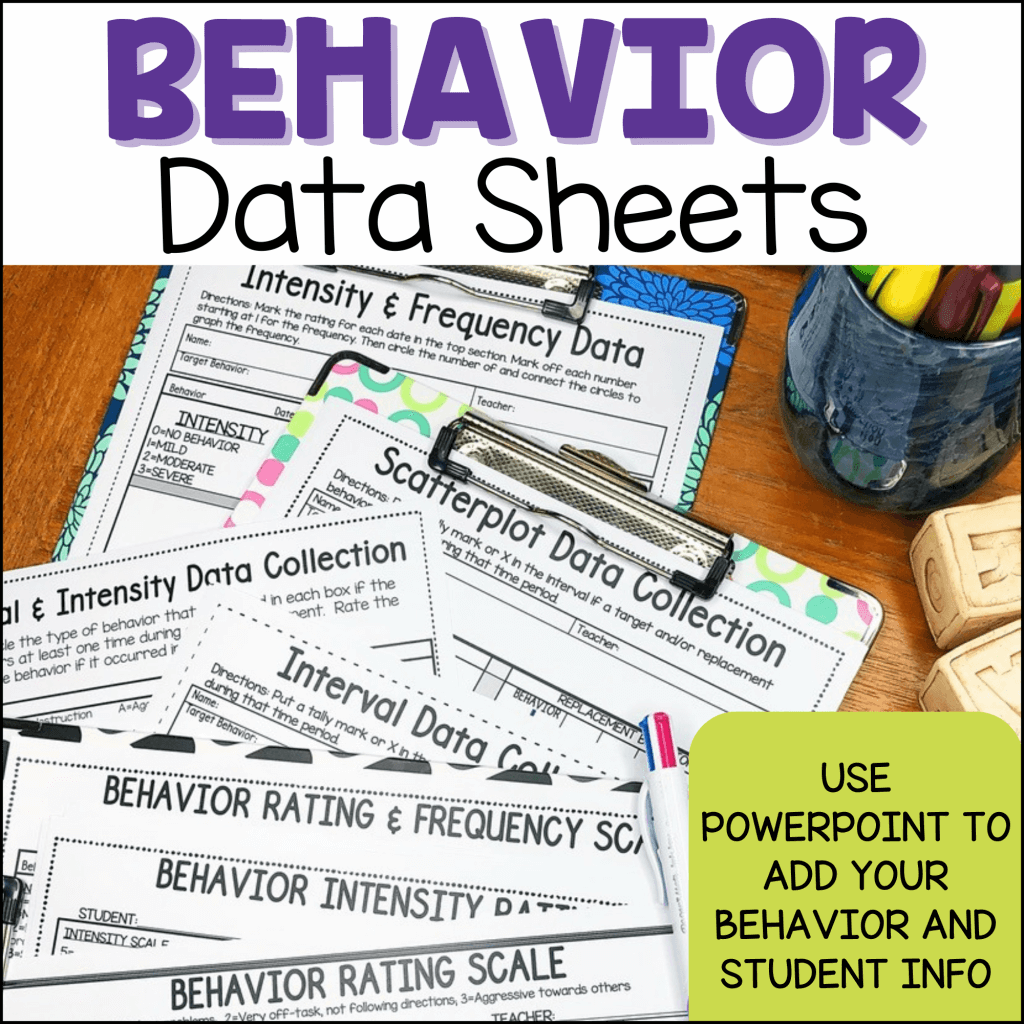
And there are Scatterplot behavior data collection sheets with and without replacement behaviors as well as with times or activities.
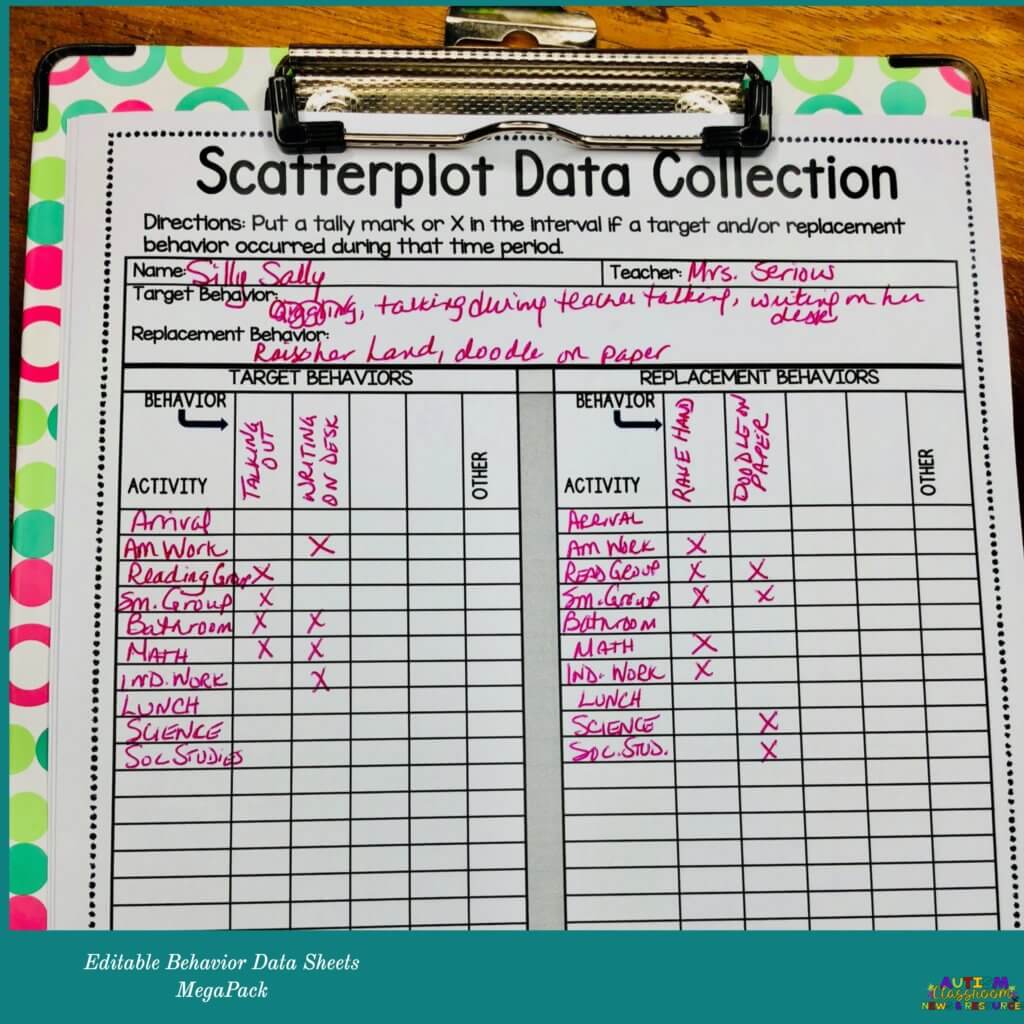
You can check out the behavior data collection sheets below.
![Behavior Data Sheets: PowerPoint and Google Slides; add student information; 6 types of data collection; 36 variations of data sheets [picture behavior intensity rating scale with data collected]](https://autismclassroomresources.com/wp-content/uploads/2022/06/Behavior-Data-Sheets-Cover-6-2-25-768x768.png)
Behavior Data Sheets – Editable Behavior Tracker MegaPack for Special Ed & RTI
Looking for behavior data sheets that can make data collection easier? If you need tools for functional behavior assessment or monitoring behavior support plans, this
Frequently asked questions about behavior data collection
What is a behavior data collection sheet?
It’s a form for recording a student’s behavior over time so you can make decisions with data instead of a gut feeling. Depending on the sheet, you might track how often a behavior happens, how severe it is, when it shows up, or what happened right before and after.
What are the main types of behavior data?
The most common are frequency (how many times), duration (how long), interval (whether it happened during a set chunk of time), intensity or rating (how severe), and ABC (antecedent-behavior-consequence). Most classroom situations are covered by some combination of these.
What is ABC data collection?
ABC stands for antecedent, behavior, consequence. You record what happened right before the behavior, the behavior itself, and what happened right after. Over time, the patterns help you figure out why a behavior is happening — which is the whole point of an FBA.
What is interval data, and what’s the difference between partial, whole, and momentary?
Interval data means you watch for a behavior during set chunks of time. With partial interval, you mark it if the behavior happened at any point in the interval. With whole interval, you mark it only if it happened the entire time. With momentary interval, you check at one specific moment (like the end of the interval). Partial interval tends to be the most realistic in a busy classroom.
What is a scatterplot in behavior data collection?
A scatterplot tracks when a behavior happens across the day, by time or activity. It’s a fast way to spot patterns — for example, that meltdowns cluster right before lunch or during a specific transition — so you know where to focus intervention.
How do I choose the right behavior data sheet for a BIP?
Start with the question you’re trying to answer. If you want to know whether a behavior is improving, a rating scale or frequency sheet works well. If you’re trying to understand why it’s happening, reach for ABC data. You don’t need to track everything — pick the one measure that tells you what you need to know without burying your staff in paperwork.
About the author: Dr. Christine Reeve (BCBA-D) has spent more than 30 years working in and around special education classrooms as a school administrator, researcher, board certified behavior analyst, and consultant. She is the creator of Autism Classroom Resources and the Special Educator Academy.