5 WAYS TO MAKE YOUR IEP DATA COLLECTION WORK IN YOUR CLASSROOM
WRITE DATA-FRIENDLY GOALS
The first is that you need to write data friendly goals. Now I know that everybody has had a ton of training probably on writing goals that are measurable and things like that. But there are a few other things that you can do to your goals that can make or break your data collection down the line.
Write your mastery criteria so that it makes sense for the skill AND it makes sense for your classroom. If you are talking about initiation of interaction, the percentage of times the student initiates doesn’t make much sense because when it is NOT an opportunity for a student to initiate an interaction.
But also don’t write the goal so that you have to take data on everything, all the time. You do not need to take data on #allthethings #allthetime. In our data course in the Special Educators Academy I talk a lot about the fact that I would rather have a reliable sample of data that shows me if a student is progressing than random observations that I don’t know if they are accurate. There’s a ton more to say about that, but generally, make sure that your mastery criteria doesn’t require you have eyes on the student every minute he is in your classroom unless someone is with him every minute he is there.
And of course make sure your goals are measurable. 😉
MAKE A PLAN FOR IEP DATA COLLECTION
Making a plan is critical because otherwise you are throwing data into the classroom and seeing where it sticks. And that is not going to give you the data you need to make decisions down the road. It’s also probably not going to be really reliable or accurate.
I use the Teaching Implementation Plan (TIP) or the Comprehensive Autism Planning System (CAPS) to help organize both instruction and data collection. They both lay out the goals for the student and account for how data will be taken in the classroom. The thing I like about the TIP is that it focuses specifically on the IEP so that you know when it’s complete you know how you are going to teach each skill in the IEP and how you will track it.
Plans are also important because you should not be the only person taking data on the team or in your classroom. Your paras likely spend a good bit of time with your students, often when you may not be there to observe. Their data should tell you how the students are doing during that time. And it should take some of the load off you for data collection. Having a plan communicates to them what you need and what information needs to be recorded at what time.
CREATE A SYSTEM OF IEP DATA COLLECTION
If you have a plan then the systems is going to be easier. However, you still need to think about how yo are going to deploy your data collection.
So many times people ask me, “Is there a data sheet for this?” Or “Is there one data sheet I can use for everything?” Look, I would love to tell you that there is a data sheet that will solve all your problems, but there isn’t.
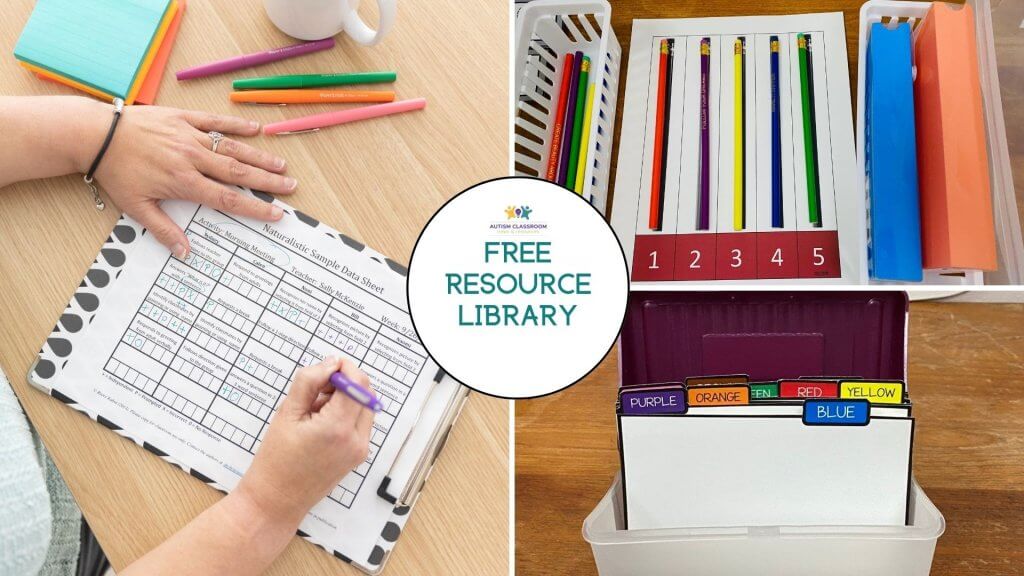
There are definitely user-friendly data sheets, like my data sheets that self-graph, rating scales, and data sheets that allow you to have teaching programs in front of you with the data. Some data is easier to take than others.
If we could use work product for every single goal, I would do it. Because it’s a ton less data to collect if I can just record the prompting and extra information needed on the work product and put it in the file cabinet. But we can’t because some things don’t work that way. And that’s why a system of data is so important.
I have a system that I use to set up classrooms initially. And yes, it changes a bit for each classroom. Not only are everyone’s goals individualized, but your organizational style is individualized as well. so each system is going to look different in different classrooms with different staff. But it’s important that we implement the plan in a systematic way.
So I’ll link to the free data webinar I have that you can take whenever you need it. It shows you a beginning plan for most classrooms to get started to take instructional data. It’s completely free and on demand. It shows you the beginning plan for getting a system in a classroom started to take instructional data. So it focuses just on instructional data.
ANALYZE YOUR IEP DATA
If you don’t analyze your data, you really don’t know for sure if your student is meeting mastery or if the skill is foundering and hit an plateau. Analyzing data means more than just looking at the data though.
If you use self-graphing data sheets, it might mean just reviewing the graphs. But if you aren’t, you need to graph your data or have a regular review of your work product. It doesn’t have to involve a ton of math but every week or so you need to be looking at your students’ progress to determine if they are going up the line toward mastery or not going to reach that mastered point in time. Draw a line on your graph from where the student starts to the mastery level on the data it has to be mastered and see if the data is going up the graph.
I have a free Excel template that graphs your data for you. You can use it to graph data from my group or embedded data sheets that I talk about in my system. They don’t self-graph and they need to be put into a graphed format. The Excel document is designed to let you put the data in and it will graph itself.
USE YOUR DATA TO PREDICT GROWTH
IEP writing should not be a complete shot in the dark in terms of guessing what the student can accomplish. If he learned to read 100 sight words this year, then I wouldn’t expect him to read 1,000 next year. I would look at the trajectory of the data and see where I think he can get by the end of next year by just extending that line.
The same is true for reducing behavior. What progress was made this year should predict the progress we can make next year. Then if there are extenuating circumstances, it’s easier to explain why you chose the goal you did.
Now, obviously our students are not automatons and everything changes in the new year. So there are always going to be extenuating circumstances. But it’s a lot easier to explain why you chose the goal you did when it’s based on data rather than just a shot in the dark.
So those are the five things that you want to think about in setting up your data to make sure that it is working hard for you. You work hard to take your data, it should be working for you, not just be something else on your to do list.